Dashboard
The Dashboard provides a central overview of your network’s performance, charger activity, and key operational metrics. It is divided into five main areas that allow you to monitor revenue, consumption, and charger health at a glance.
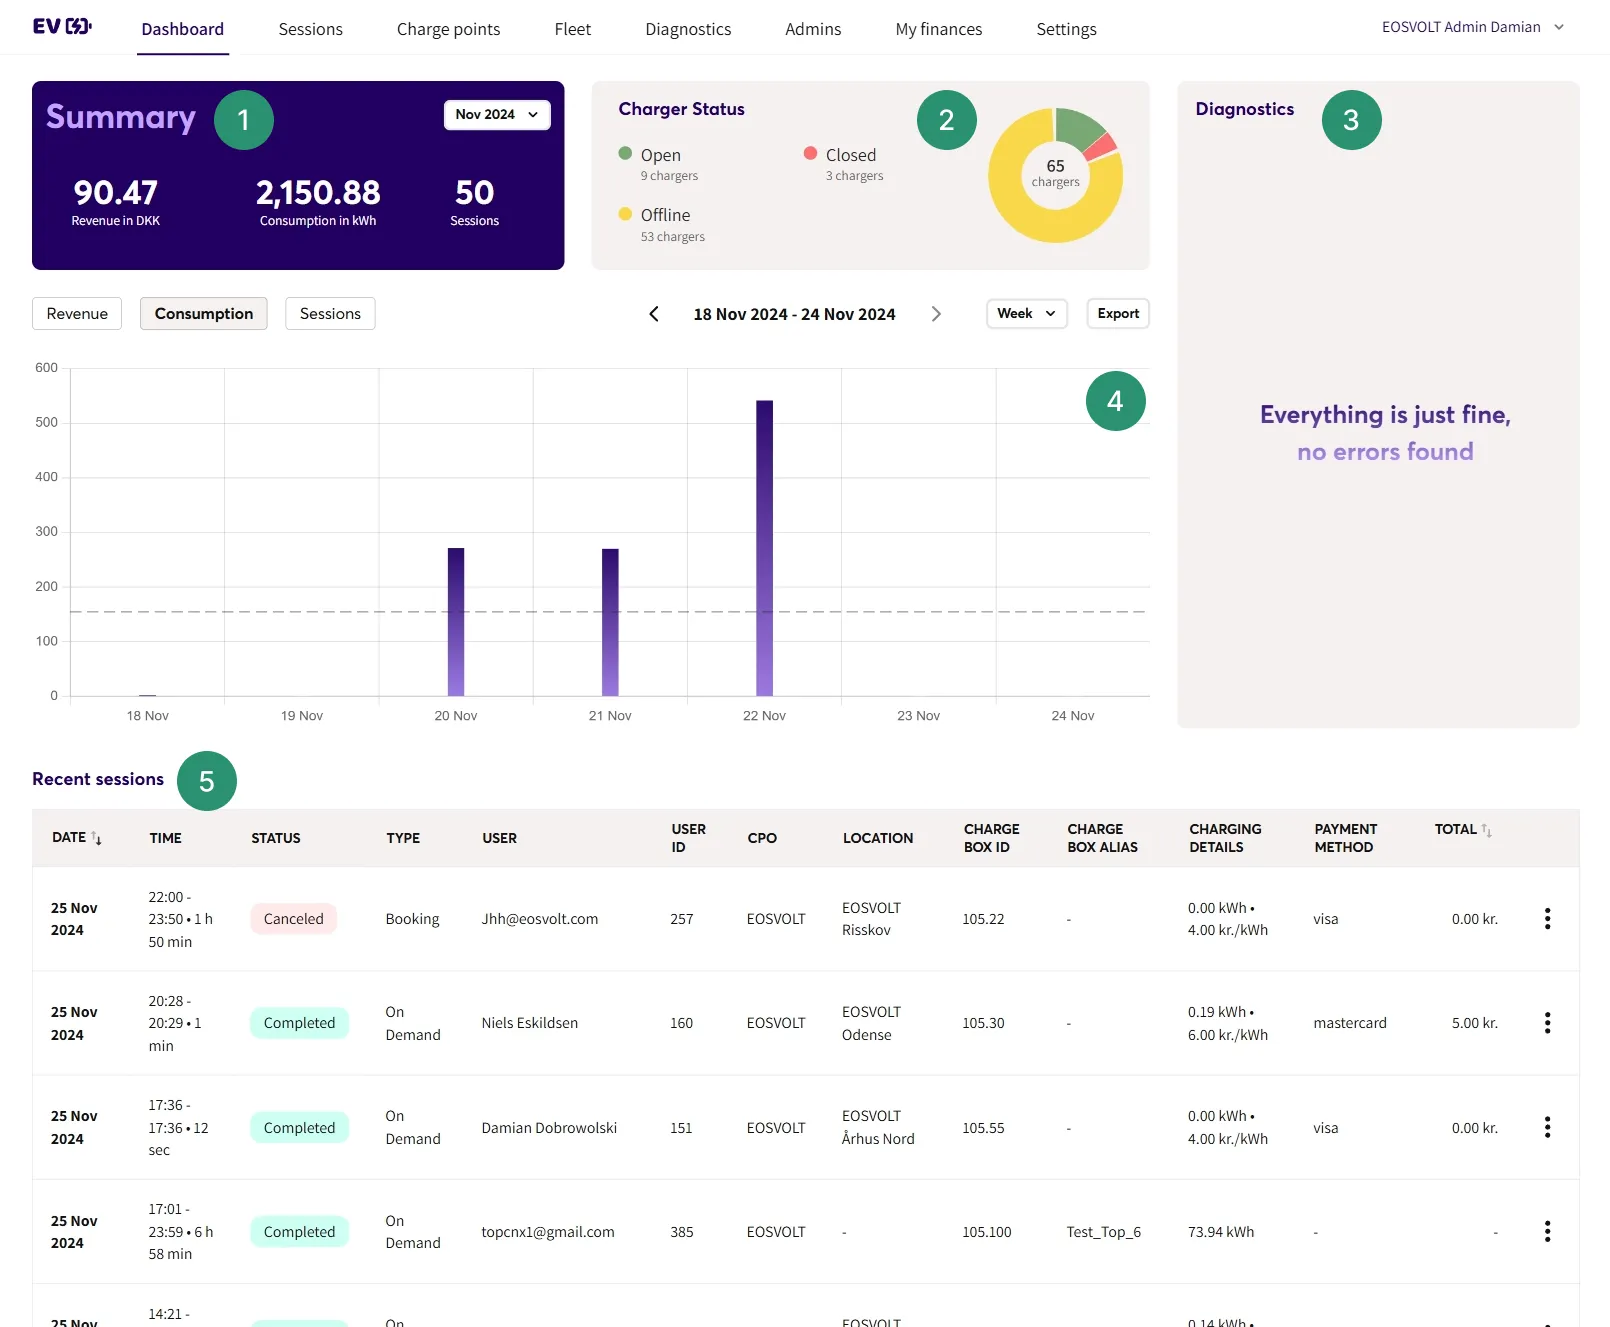
Summary
The Summary section provides a monthly overview of your key performance indicators:
- Revenue — Total income generated from charging sessions.
- Consumption — Total energy dispensed (kWh).
- Session Count — Number of sessions completed within the selected timeframe.
You can adjust the time range using the dropdown menu to view data by day, month, or year.
TipUse this view to quickly compare performance trends across time periods and spot usage peaks or seasonal variations.
Plug Status
This section shows the charger/connector’s OCPP StatusNotification state in real time.
OCPP 1.6 Statuses (per connector)
- Available — Idle and ready to start a new session.
- Preparing — EV plugged in and/or authorization in progress; pre-charge setup before energy flows.
- Charging — Energy is being delivered.
- SuspendedEV — The EV requested a pause (e.g., battery full, user paused) while still plugged in.
- SuspendedEVSE — The charger/site paused delivery (e.g., load balancing, grid limit, tariff window).
- Finishing — Charging stopped; waiting for user to unplug / session wrap-up.
- Reserved — Connector is held for a booking/reservation; not available to others.
- Unavailable — Temporarily out of service (maintenance/admin), not due to a fault.
- Faulted — Error prevents operation.
NoteEOSVOLT does not rely on the OCPP Reserved state. We manage bookings and connector reservations through our backend logic.
Diagnostics
The Diagnostics panel displays alerts and error reports submitted by your chargers. This section helps operators detect technical issues early and troubleshoot them efficiently.
TipCombine this with the OCPP Log Download feature in the charger view for detailed error analysis.
Graph
Get a visual performance overview of your network. View and compare:
- Revenue
- Energy consumption
- Session count
- Utilization
- Uptime
Time filters
Filter any metric by week, month, or year.
Additionally, For Utilization and Uptime, you can also filter byLocation,Charge box ID or Plug ID
Tip: Combine a time filter (e.g., month) with a specific Charge box ID to spot device-level trends without noise from other hardware.
Tip: Combine a time filter (e.g., month) with a specific Charge box ID to spot device-level trends without noise from other hardware.
Export FeatureUse the Export (XLSX) button to download your current dataset for external reporting or accounting.
Recent Sessions
The Recent Sessions list shows your ten most recent charging sessions. From this section, you can:
- Review key session details (user, location, duration, and cost).
- Access detailed session insights.
- Download session logs directly.
Recommendation Regularly monitor this section to confirm new chargers are reporting correctly and transactions are being logged without errors.
Updated 1 day ago