
Dashboard
See your network at a glance: this month's revenue and sessions compared with last month, the live state of every plug, performance graphs and your latest sessions.
The Dashboard shows how your network is doing this month and what every plug is doing right now. Open it to check the month, spot a change in use and jump to your latest sessions.
At a glance

- Revenue: charging revenue for the month, idle fees included, with the month picker and the comparison with last month.
- Plug status: how many of your plugs are in each state right now, with the count of chargers and plugs.

- Sessions: sessions started this month, and how many are in progress.
- kWh delivered: the energy your chargers delivered this month.
- Idle fees and Booking fees: what these fees brought in this month.
- Active users: how many of your users charged this month, out of all your users.
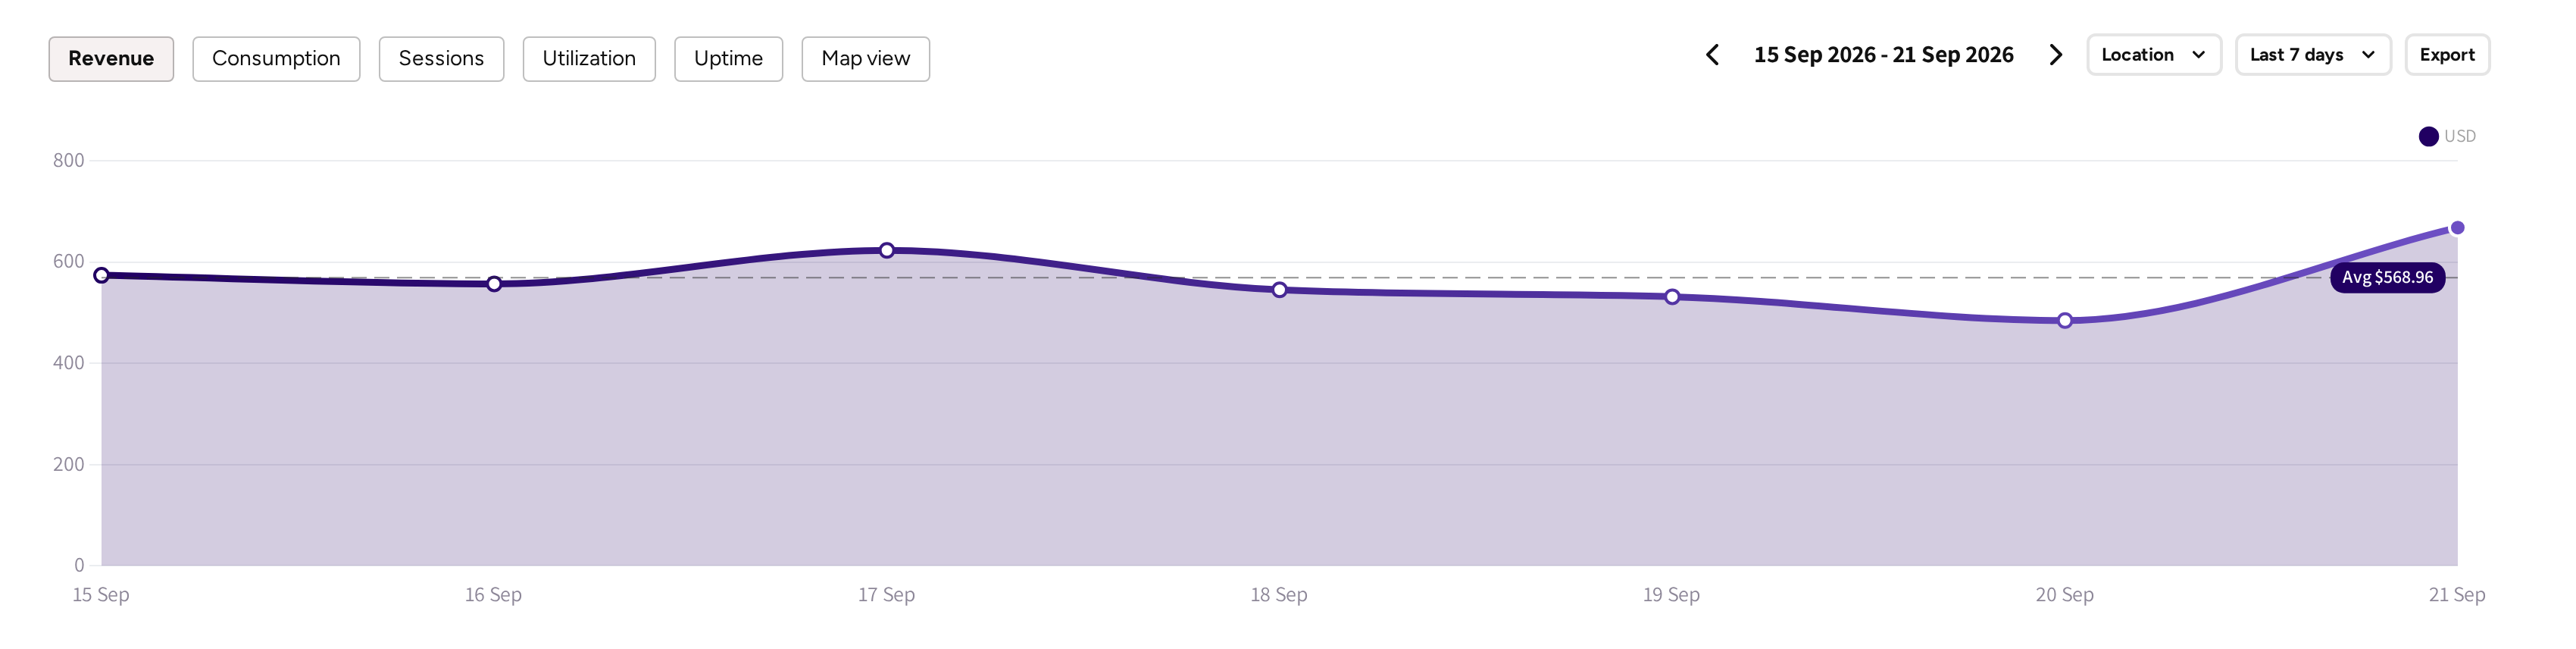
- Revenue, Consumption, Sessions, Utilization, Uptime and Map view: the graph tabs.
- The date range with its arrows, Location and Last 7 days (the interval): what the graph covers.
- Export: downloads the data behind the graph.
Read the month
The top of the page covers one month. It opens on the current month.
- Open the month picker in the top right of the Revenue card.
- Pick the month you want to read.
Every figure in the card and the tiles follows the month you pick. If your account books in more than one currency, then a Currency picker appears next to the month picker.
If a user does not have permission to view revenue, then the large card shows Sessions, and the line under it names the month.
Compare with last month
Each figure has a small chip with the change against the previous month. An arrow up means the figure grew.
- If the month is still running, then it is compared with the same days of the month before. The chip then reads, for example, vs 1 to 28 Aug 2026.
- If the month has finished, then it is compared with the whole previous month.
- If last month has nothing to compare with, for example before your first sessions, then the chip reads No previous data.
Hover the info icon next to a chip to read in words which figure is compared, and over which days.
Check the plugs right now
Plug status counts your plugs by the state each charger reports, live. The bar under the list shows the same split in colour.
| State | What it means for you |
|---|---|
| Available | The plug is free and ready for a new session. |
| Preparing | A vehicle is plugged in and the session is starting. |
| Charging | Energy is flowing to the vehicle. |
| SuspendedEV | The vehicle paused the charge while it stays plugged in, for example because its battery is full. |
| SuspendedEVSE | The charger or the site paused the charge, for example to share power between plugs. |
| Finishing | Charging has stopped and the driver has not unplugged yet. |
| Reserved | The charger reports the plug as reserved. |
| Unavailable | The plug is taken out of service, for example for maintenance. |
| Faulted | An error stops the plug from charging. |
If a plug is in Faulted or a charger stays offline, then it also shows up in Intelligence, where you find what to do about it.
Read the graphs
The graph area shows your network over time, one tab per measure.
- Pick a tab: Revenue, Consumption, Sessions, Utilization or Uptime.
- Pick the interval: Last 7 days, Week view, Month view or Year view.
- Use the arrows beside the date range to step back or forward one interval.
- Narrow the graph to one site with Location.
The dashed line marks the average over the range, and Today marks the current day. Map view shows your locations on a map instead of a graph.
If you oversee other operators, then the CPO filter narrows the page to one of them.

If you open Utilization or Uptime, then the filters add Charge Box and Plug, and a Day view that shows one day hour by hour. Use them to look at one charger without the rest of the network.
Export the graph data
- Set the tab, interval and filters you want.
- Click Export.
You receive a CSV file with the data behind the graph on screen.
Open a recent session
Recent sessions at the bottom of the page lists your ten latest charging sessions, newest first. It has the same columns as the Sessions list.
- Open the menu at the end of a row.
- Click View session details to open the full record of that session.
The same menu has Download Logs, the charger's log of the session. If the session has finished and has an invoice, then the menu also has Download invoice.
Your own dashboards
If Dashboard opens as a group in your menu, then this page is the first item in it, and the dashboards you build yourself are on My dashboards.
Common questions
How much revenue did my network make this month? The Revenue card at the top of the Dashboard shows it for the current month, idle fees included. Use the month picker to read another month.
Why is my revenue lower than last month? If the month is still running, then the chip compares it with the same days of last month. Look at the chip text: it names the days it compares.
What does SuspendedEV mean on a plug? The vehicle paused the charge while it stays plugged in, for example because its battery is full. SuspendedEVSE means the charger or the site paused it instead.
How do I see the utilization of one charger? Open the Utilization tab and pick the charger in Charge Box, or one plug in Plug. Day view shows a single day hour by hour.
How do I export dashboard data? Set the graph tab, interval and filters, then click Export. The download holds the data behind the graph on screen.
Updated 12 days ago