
Location analysis
The Locations tab lists your sites worst first with how many chargers are online, and each site has an analysis page with site uptime, charge success, utilization, a per charger breakdown, open issues and the faults in the period.
Some problems belong to the site rather than to one charger: a grid supply that sags at the same hour every evening, a network outage that takes four chargers down together, a car park where every unit reports the same thing. This is where those show up.
The Locations tab
The tab lists your sites sorted by attention needed, worst first. Like the Chargers tab, it ignores the period picker above it, because a directory that reshuffles when you change a chart is unusable.
| Column | What it tells you |
|---|---|
| Location | The site name with its address underneath |
| Chargers | How many chargers the site has |
| Online | How many of them are connected right now, for example "3 of 4". The dot is only green when the whole site is up |
| Site uptime · 7d | Connected charger hours against all charger hours over the last week, so one charger down moves the number |
| Active issues | The open issue count, with the critical share called out in red |
| Last session fault | How long ago, or None in 14d |
Search by location name or address. Clicking a row opens the site. On a phone each site becomes a card instead of a row.
The site page
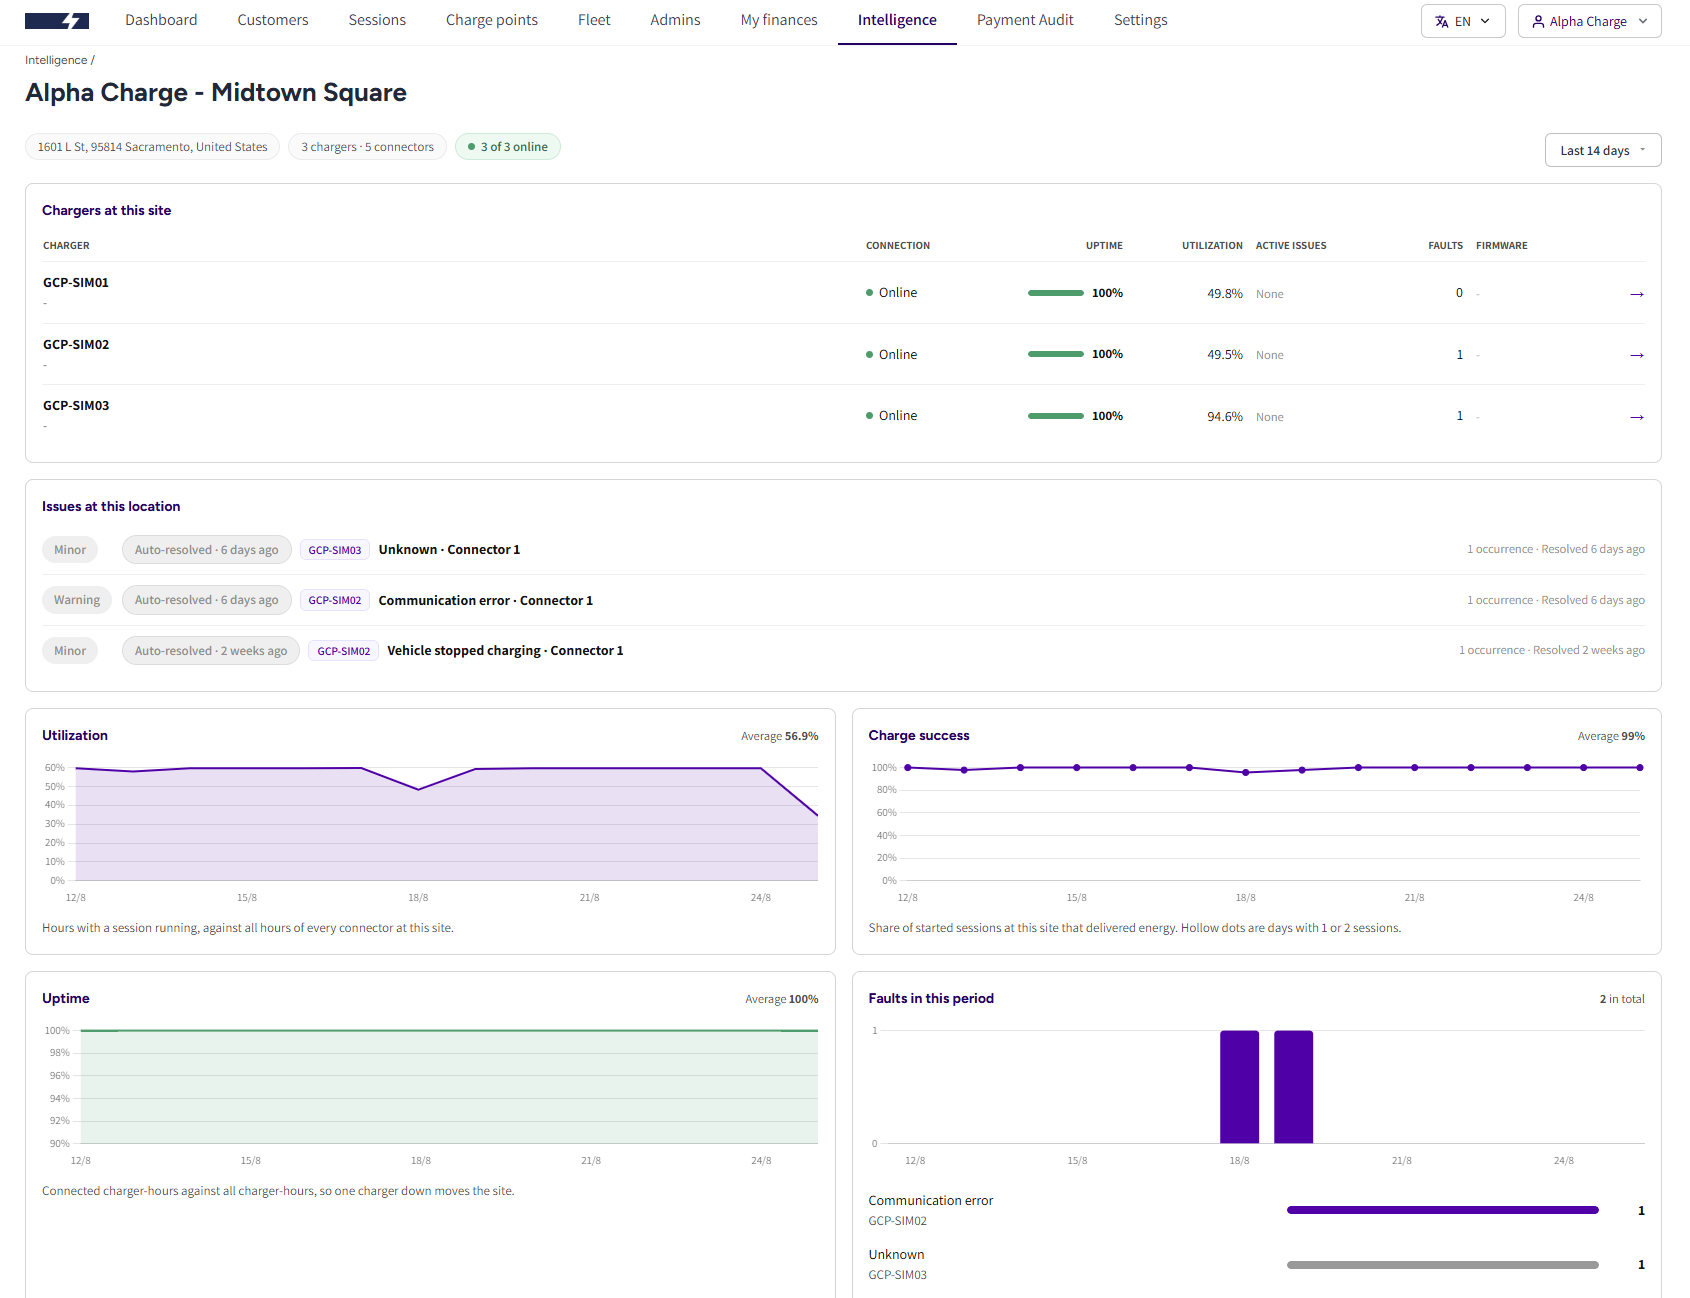
The header carries the address, the charger and connector count, how many chargers are online, and an Issues detected pill when the site is carrying open issues. Every charger can be online while the site still has open issues, which is exactly what this page is for.
A period selector covers Last 14 days, Last 30 days and Last 90 days, and governs every card.
Chargers at this site
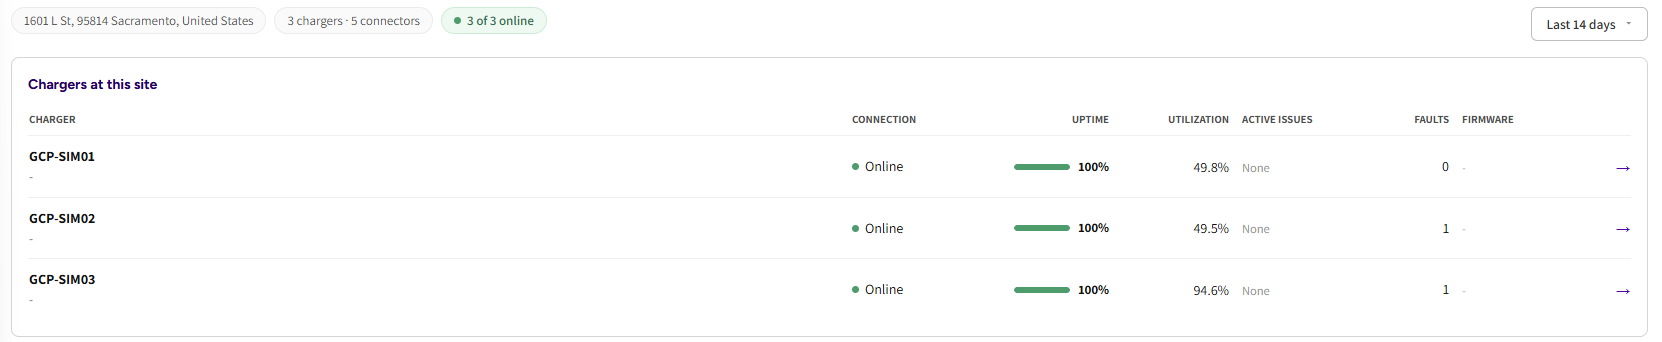
Every charger on the site in one table: Charger, Connection, Uptime, Utilization, Active issues, Faults and Firmware. This is the fastest way to tell a site problem from a charger problem. If one row is bad and the rest are clean, it is that charger. If every row shows the same dip, it is the site.
Each row opens that charger's own analysis page.
Site uptime, Charge success and Utilization
The same three measurements as a single charger, aggregated across the site:
- Uptime: connected charger hours against all charger hours, so one charger down moves the site number.
- Charge success: the share of started sessions at the site that delivered energy. Hollow dots mark days with only one or two sessions.
- Utilization: hours with a session running, against all hours of every connector at the site.
Issues at this location, and Session faults in this period
Every open issue across the site, and the individual session faults inside the selected period, both linking through to the full detail.
Common questions
Site uptime is 75% but all my chargers say online. Uptime covers the whole period, not this moment. Open Chargers at this site and look at the per charger uptime column to find which unit was down and when.
One charger is dragging the site number down. That is the intended behaviour. Site uptime weighs charger hours, so a four charger site with one unit offline all week cannot read as healthy.
Should I look at the site or the charger? Start at the site when several chargers misbehave together or when a driver complains about a place rather than a unit. Go straight to the charger when you already know which one.
A location is missing from the tab. Locations appear once they have chargers attached. A site with no chargers has nothing to analyze.
Updated 21 days ago