

Energy
The live view of how your sites are using their available power: total draw, which zones are limiting right now, zone errors that need acknowledging, and a drill-down from the whole network to one site to one zone.
Energy is the live picture of how your network is using the power it has. It answers one question at three depths: is the whole network fine, is this site fine, and why is this zone holding sessions back. Everything here is monitoring. The limits themselves are set per site, on the location's own Load balancing tab.
The menu item opens the Energy management page, which has two tabs: Load balancing and Batteries. Load balancing appears in two places in Spark, and they do different jobs: the Load balancing tab on a location is where you set a site up (zones, chargers, limits, schedules), while the Load balancing tab under Energy is where you watch all of those zones live, across every site.
NoteThe Batteries tab is only available for operators with batteries connected to their account. This guide covers the Load balancing tab.
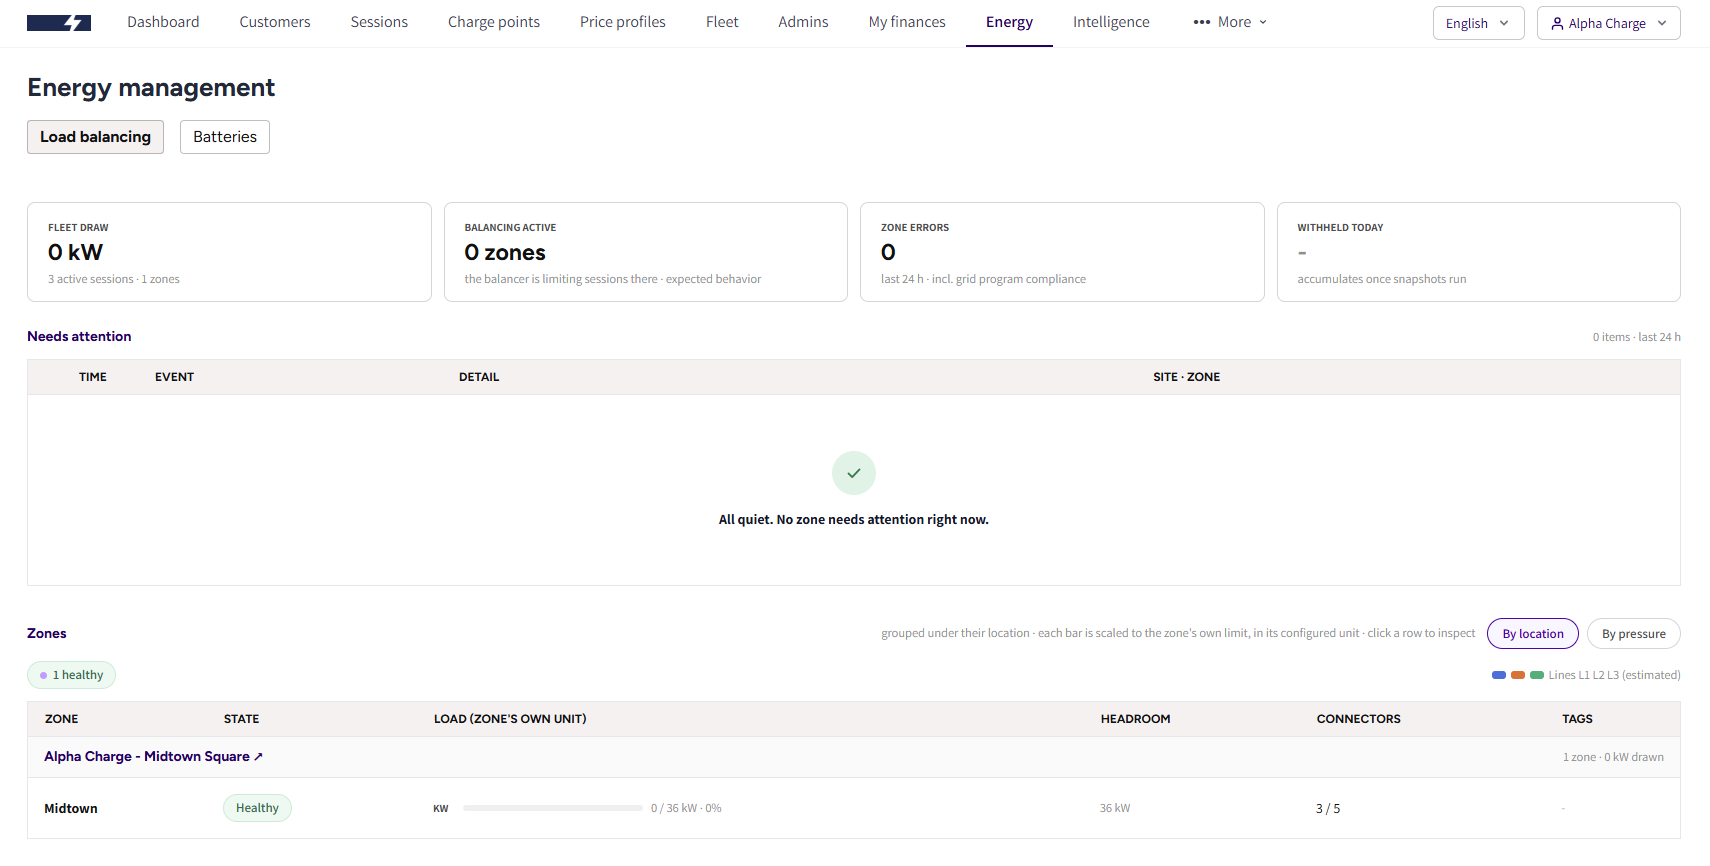
The Load balancing tab
The four tiles
Across the top, four numbers for the whole network right now:
- Fleet draw: how much power all your chargers together are pulling right now, with the number of active sessions and zones underneath. Fleet here means your whole charger network, not the Fleet section for companies and drivers.
- Balancing active: how many zones the balancer is currently limiting. This is the balancer doing its job, not a fault. It means demand at those sites is above what the zone is allowed to hand out, so sessions there are being held to a lower power on purpose.
- Zone errors: errors reported in the last 24 hours.
- Withheld today: how much charging was held back by the limits you set.
Needs attention
Under the tiles, a list of what has gone wrong in the last 24 hours: missing heartbeats, missing group measurements, capacity compliance errors. Each row shows the time, the event, the detail, and the site and zone it belongs to. Clicking a row opens that zone.
Press Acknowledge on a row once you have dealt with it and it leaves the list. When nothing is outstanding, the list says so plainly.
Zones
The zone list is the heart of the page. Its columns are Zone, State, Load, Headroom, Connectors and Tags, and each zone's load bar is scaled to that zone's own limit in its own unit, so a kW zone and an Ampere zone can sit in the same table and still be read at a glance.
Two orders are offered, and the toggle above the table switches between them:
- By location: zones grouped under the site they belong to. This is the default, and the right one for a walk through the network.
- By pressure: every zone sorted by load, busiest first. This is the one for "who is closest to their limit right now".
Each zone carries a state chip, and the chips are counted above the table:
| State | What it means |
|---|---|
| Healthy | Charging is running and the zone is comfortably inside its limit |
| Idle | Nothing is charging in the zone |
| Near limit | The zone is close to its limit and the next car may be held back |
| Limiting | The balancer is actively reducing session power to stay inside the limit |
| Balancing off | The zone is disabled, so its draw is monitored but nothing is being controlled |
A legend on the right reads Lines L1 L2 L3 (estimated). Per line figures are estimates, worked out from each charger's phase wiring and what it is drawing, not readings from a meter on the line. They are accurate enough to tell you which line is the bottleneck, and they are not a billing figure.
Accounts that oversee more than one operator get a CPO filter above the page, to narrow everything to one of them. A single operator account does not see it.
TipThe live figures refresh every 10 seconds while the tab is in front of you, and pause while it sits in the background.
Looking into one site
Clicking a location opens Zones at this location: every zone at the site with the same state, load and headroom reading, plus a summary line with the site's total draw and how many connectors are in use. Location events underneath lists the site's events from the last 24 hours across all of its zones.
From here, Open location takes you to the site's own page, where the configuration lives.
Looking into one zone
Clicking a zone opens its full picture:
- Effective limit: what the zone may actually hand out, with the grid capacity buffer already subtracted. On Ampere zones this is per line.
- Zone load: how much of that limit is in use.
- Imbalance: how unevenly the three lines are loaded, on zones where that can be worked out.
- Distribution: whether the zone shares power dynamically or in arrival order, and the guaranteed floor every session keeps.
- Line loading: the estimated load on L1, L2 and L3. Select a line to highlight the chargers drawing from it, which is the fastest way to find out why one line is running hot.
- Chargers in this zone: every charger with its status, power, estimated current, how much of its own maximum it is getting, and that maximum. A charger with no phase wiring set is marked as excluded from the line estimate.
- Zone events: that zone's own events from the last 24 hours.
Where zones are configured
Nothing on the Energy page changes a setting. Creating a load balancing zone, assigning chargers to it, and setting its limits and schedule all happen on the location's Load balancing tab, and both the site view and the zone view carry a link straight to it. See Load balancing.
Before your first zone
An account with no zones yet sees a dimmed sample of the page behind a short panel headed Make the most of your available power, so you can see the shape of what you get before you build it. Set up your first zone takes you to your locations, where you pick the site to start on.
The sample is example data and is marked as such. Nothing in it comes from your network.
Who sees Energy
- The menu item needs the Energy module on your admin account. It is on by default for operator admins, and your account owner can switch it off for an admin who does not need it.
- Acknowledge additionally needs Load balancing access, the same access that lets an admin configure zones on a location.
Common questions
A zone says Limiting. Is something broken? No. Limiting means the balancer is doing exactly what you set it up to do: demand at that site is above what the zone may hand out, so sessions are held to a lower power until capacity frees up. It is worth a look only when it happens far more often than you expect.
Why do the per line figures say estimated? They are worked out from each charger's phase wiring and what it is drawing, not read from a meter on each line. That is enough to tell you which line is the bottleneck and which chargers sit on it, but it is not a metered value and should not be used for billing or for proving anything to your utility.
A charger is missing from the line loading picture. Its power configuration has no phase wiring, so the platform does not know which lines it draws from, and the zone view marks it as excluded from the line estimate. Set its phase wiring in the Edit Charger form and it joins the picture.
How do I change a zone's limit from here? You cannot. Energy is monitoring only. Use the link to the location's Load balancing tab, or open the site from the location view.
Why can I see the page but not acknowledge an event? Acknowledging needs Load balancing access on top of the Energy module. Ask your account owner to add it.
Withheld today is empty. The figure builds up over the day, so a freshly configured zone, or an account early in the day, can show nothing yet.
Updated about 2 hours ago